Welp, d3 did indeed turn out to have a steep learning curve. This isn’t a normal package that you can just grab, use, and throw away (though I’m a JavaScript novice, as well). Luckily, I got my hands on an amazing, lifesaving, should-be-the-offical-documentation level book. Get this!
D3 for the Impatient by Phillipp K. Janert.
My impression so far is that the essential operations of d3 are selection, grouping, chaining attributes / appending, and aligning data with image components (with whatever importing, creation, trimming, etc. of images or data that might be necessary).
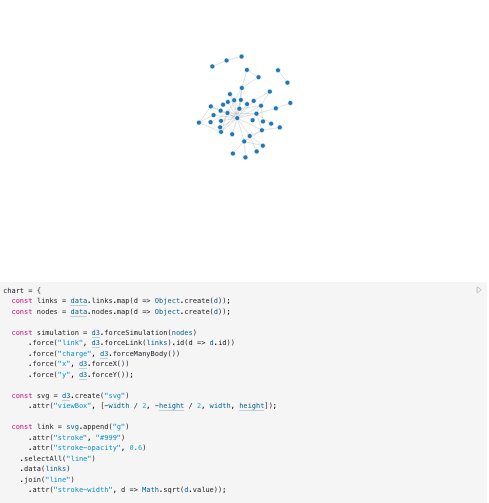
This is my first js widget too 🙂 So, let’s take a look at the js and I’ll explain what I did.
The whole thing is going to be a heart made out of colored bars (this was a birthday card for my partner) which change color and spell out “HAPPY BIRTHDAY” when you hover over each bar in turn.
The first thing you see looking in the js is the data that we will be associating with the widget. d3 stands for “data-driven documents”. I chose to make an array of arrays which each contain the information for one bar. a height factor, a width factor, and a letter that will be visible when we hover our cursor over the associated element.
I think of working in d3 as though you are in a jungle swinging vine to vine and adding leaves onto the vines as you go. First, to create the canvas that we are working on, we grab on to the body tag of the larger HTML document and append an SVG block. We specify the dimensions we want for it by appending those dimensions as attributes.
Now, here’s an example of the weird part. We grab on to the SVG canvas we just made (technically, it’s actually a window into the underlying canvas, but for our purposes it’s the canvas itself) and “select all the rectangles in it”. As of now, there are no rectangles in it, but we do it anyway. So we are holding on to an empty, null element. We associate the dataset we talked about earlier to this “set of rectangles” that doesn’t have anything in it. Now, when we use the .enter() method, the magic happens. This adjusts the set of rectangles to contain an appropriate number of rectangles for all of the data elements (those inner arrays that “are” the individual bars), so now we do have rectangles! (There is a way to do the opposite in d3 too, where you can trim the object set or trim the data set to match eachother.)
From now on, everything we do in this little “stanza” of code (known as method chaining), we are doing to the individual bars, all at once. We append all the attributes we want, referring to the contents of the data at will when necessary. Color, size, behavior. An interesting moment is where we append a class as an attribute. That class is “bar”, and check out what that means in the CSS tab. “Bar” means that it changes color to pink when you hover over it. The title and text lines use the letters (“H”, “A”, etc. in “HAPPY BIRTHDAY”) from the bar-associated arrays in our associated data to create tooltips when you hover over each bar.
I’m really happy about this! It’s so stimulating and dopamineurgic to create something that actually interacts with you, and d3 gives you such fine control over every aspect. I can’t wait to use this for my networks.
PS the FreeCodeCamp course in d3 is so good. This is a pretty niche-community package so if you’re interested, please take my advice and bookmark this link and get the book I showed above (I might take some pictures inside the book later).
I’ve improved the presentation of my network model for global terrorist collaborations. You can take a look atthe codeon my github, and definitely follow the link to view the network in full.
Please note that I replaced the node IDs for “the” Taliban (T), Boko Haram (BH), ISIL/ISIS (IS), Hamas (H), and”the” Al-Qaeda (without a regional modifier in the name) (AQ) by the initials herein, so that they can be easily pinpointed on the graph. You’ll probably want to open the lengthynode keyin another window.
A few notes:
Criteria for inclusion. Please refer to my previous post.
Node Clean-up. I got rid of the nodes “Unknown”, “Individual” (meaning a non-organization), and “Other”, which had escaped my attention and unduly linked some pairs of organizations as having one degree of separation (e.g. both Group A and Group B collaborated with persons who were never discovered– this doesn’t mean they collaborated with the SAME person!). I’m also noticing some nodes here and there that have basically the same problem, such as “Palestinians”– that is not an organization. I will return to these sorts of nodes and remove them on a case-by-case basis.
Community Detection. I used the “fast greedy” community detection algorithm to assign and color the communities. Here is a comparison of community detection algorithms for networks with various properties. Before executing this algorithm, I combined any multiple edges between a pair of nodes into a single weighted edge, and got rid of loops (since “collaboration with oneself” is not what I was intending to portray in this model).
Let’s take a look at the output given by R. Upon inspection, these groupings seem to make sense; the organizations seem plausibly affiliated and frequently refer to the same cultures, regions, or ideologies. Some of the names could use a bit of clarification (for example, “Dissident Republicans” refers to breakaways from the IRA toward the end of the Northern Ireland conflict) or expansion/compression. As you may infer, the numberings to the left of the members of a group are not the node IDs that appear in the rainbow graph later, but rather numberings within the communities (only the first number is shown per line of community members).
Cliques. The largest cliques (complete subgraphs) were revealed as:
Clique 1. Bangsamora Islamic Freedom Movement (BIFM), New People’s Army (NPA), Moro National Liberation Front (MNLF), Moro Islamic Liberation Front (MILF), Abu Sayyaf Group (ASG)
Clique 2. Popular Resistance Committees, Popular Front for the Liberation of Palestine (PFLP), Hamas, al-Aqsa Martyrs Brigade, Democratic Front for the Liberation of Palestine (DFLP)
Centrality. I wanted to know how “influential” each node was. Of course, centrality is not the only way to measure this, especially in a case like the GTD where we have so much other information, such as victim counts. Even going on centrality, there are several centrality measure options in igraph for R; I went with eigencentrality. To quote from the manual:
“Eigenvector centrality scores correspond to the values of the first eigenvector of the graph adjacency matrix; these scores may, in turn, be interpreted as arising from a reciprocal process in which the centrality of each actor is proportional to the sum of the centralities of those actors to whom he or she is connected. In general, vertices with high eigenvector centralities are those which are connected to many other vertices which are, in turn, connected to many others (and so on).”
Hands-on Machine Learning with Scikit-Learn, Keras, & TensorFlow by Aurélien Géron.
Look inside and/or buy on Amazon here (cheapest source I’ve seen from a cursory search).
This is a new addition that I’m not very far into yet, but I’m sufficiently impressed already to give it a mention.
I’ll have to come back and add some commentary once I’m further along because right now I’m just in chapter 3.
The first chapter is a succinct review of branches of machine learning (e.g. supervised vs. unsupervised vs. semi-supervised vs. reinforcement; batch vs. online, etc.), brief lists of major algorithms, and a discussion of critical concepts like overfitting vs. underfitting, training vs. test sets, and identifying high- vs. low-quality data. Concepts are organized well into categories and subcategories and presented in a cohesive manner.
The second chapter is a guided, code-through, ostensibly high-level but relatively complete overview of a regression task. It details up front how to install Jupyter, how to set up a virtual environment, and all the preparatory stuff, with the full code typed out, so you can indeed start from square one and won’t get lost at the installation stage due to not knowing some element that is considered obvious by non-novices (but this only takes a couple pages). Performance measures are discussed with equations intact. (It assumes you have taken linear algebra, but it doesn’t, for example, assume you know what the l1 and l2 norms are by name; I found it to be appropriately clear without derailing as someone with both math degrees and a background in math pegagogy.) You then pull housing data from the accompanying github and preview it in raw then visually with pandas and matplotlib; data is cleaned in a realistic, reasonable way. There is a naive approach to partitioning training and test sets, inspection of the pitfalls, modification, (brief) rinse and repeat until we are fit to appreciate the problems scikit-learn is solving for us when it is introduced, and we get an overview of it. We proceed through feature scaling, custom transformers, cross-validation, comparing models and their errors, consideration of ensemble methods, and eventually evaluation on the test set. (I didn’t list nearly everything that is covered.) Deployment methods are briefly discussed. This all takes place in about 50 pages with very large margins (the font and printed area amount to that of a standard hand-held paperback, despite the dimensions of the book itself).
The book is in color, which a lot of reviews seem to love– I didn’t get why anyone cared before I was actually using the book, but I do appreciate it now while reading the code. It would be interesting if a similar colorization strategy to that of code editors were somehow employed in mathematical printing. I’m not sure if LATEX has anything like that where certain equation formats can be default colored in their output. While looking into this, I was amused to discover a survey of the LATEX font package on a pornographic image aggregator site. I wonder whether this was an in-joke, or the result of poor machine learning due to use of the word “latex” (there’s other image-heavy latex material ad copy on the site– yes, I searched the site, ha!).
Managed to get a basic interactive network setup with some hover and onclick phenomena (play with it!). I intend to expand the effects to include alteration of size (links and nodes), substitution of an image for the circle representation of a node, and the appearance of text nearby. Because nodes and links are obviously sets of very similar objects, I will create them as groups in d3, but then allow selections of individual items. These selections should trigger phenomena that will be specifically associated with that particular node. This is just a quick entry; that’s all I have to say right now.
Update: Node hover: Node expands (will eventually be pic of offender), background changes to another color via gradient. TO-DO: Tooltip with name of node (perpetrator)? Do I want that blocking part of the picture? Node click: Node outlinks, node changes color permanently. Edge hover: Edge changes color and thickness. Tooltip (dummy data, will be name of document linked to). Edge click: Edge outlinks (dummy link, will be cited document that generated the link).
Stuff I’m still figuring out: Upon node hover, bring up (or link out to) a little dataframe profile of the offender, maybe have it slide onscreen at the bottom. Ideally any data that overlaps between offenders (e.g. weapon type) could eventually be clickable to bring up a list of persons relevant to that data value for that column– so, maybe have a pandas dataframe full of the all of the data, then trigger filtering methods for certain values by clicking on those values and show the subset frame on the side of the whole thing. No idea how I would connect Python and JS/CSS/HTML (it’s probably well-known, but not by me).
Upon node hover, highlight nodes of degree 1.
Slider bar that visually grows the network over time, as you slide through each year when an event occurred. I tried to do this in Gephi and while if I recall correctly a little video animation was possible, it wasn’t possible to let the user physically move the slider around themself. I saw a demo of some new Tableau add-ons that seemed to serve this exact purpose so I’m going to take a look at that– not too familiar with Tableau and will have to see how well it can be integrated.
It’s been awhile! I’ve been doing curriculum development and tutoring for The Knowledge House, a Black-owned bootcamp serving the Bronx community that is awesome and y’all should check it out. They operate outside of “working hours” to allow students to simultaneously work full-time, cover travel, offer a stipend, and can help students with food and housing security.
Here’s their mission statement:
“The Knowledge House empowers and sustains a talent pipeline of technologists, entrepreneurs, and digital leaders, who will uplift their communities out of poverty.
We are a social change organization. We passionately believe that young people should be given the opportunity to succeed regardless of their financial circumstances or ethnic background. We educate, empower, and mentor New York City residents, from low-income communities with the technology and workplace skills needed to launch a successful career in the technology industry.
Through our digital skills programs, The Knowledge House is transforming the tech industry by building an army of talented workers equipped with the latest skills needed in today’s economy.”
Meanwhile, in my personal life…
I’ve been trying for a long time to figure out how to best render my network of rampage citations, and I’ve gone through a LOT of “failed” ideas. Maybe someday I’ll write a post detailing those trials and tribulations. The end result wound up being that the only thing I can find that does all the things I want is a JavaScript library called d3. This meant that I first needed to learn some JavaScript, which was fine. I also want to have my graph connected to my database so I don’t have to go back and recreate the graph every time another rampage happens (kind of a macabre concern, but there you have it), and to be able to put information into the database in a streamlined way– heck, maybe even enable other people to submit information. (Here’s a little featureless mock-up I did in d3 without knowing d3 [some of this stuff I understand by the time of this entry; some I just managed to cobble together looking at examples], just connected to some static trial data– the stuff we had so far in the other posts. Not fancy, but you can at least see what the code tends to look like.) And I want this to be scrapeable by the general public.
Previously I’ve had an issue where I haven’t thought ahead enough about whether the technology I’m using is going to expand well to include my end-goal features. I’ve been fooling around with various aspects of this project for a long time, since I could barely code. Back then it was more important for me to motivate myself through achievable subgoals, and I didn’t have the skills / programming maturity / vocabulary to even be able to find out what those features would entail concretely, and what packages or languages that would require, and so on– trying to design the whole thing and then fill it in piecewise like a color-by-numbers was not a viable strategy. I still don’t think I’m necessarily in a place to design the whole thing start to finish and limit myself to what I know of now, but I am at a point where I can start thinking a few more steps ahead at a time than I was before. Yet at the same time I’ll probably have to do each major step in an inferior “practice” version before I learn enough about the general category to optimize.
Case in point, because of my working at TKN (described above) I’ve been exposed to people building Flask apps, and that has a lot of the components I’m seeking. I can use SQLAlchemy to hook it up to a database, use a POST method to let people (including myself) submit stuff to the database, output everything via API, and hopefully hook up a nice d3 graph. I don’t even know about the other packages/libraries for this kind of thing, but right now I think it will be best for my learning process if I just go on ahead with this then backtrack and learn something else if it turns out it’s missing a crucial aspect. I’ve been working on one using failed/aborted/prevented school shooting attempts scraped from the same Wikipedia page as my trial data. (I have some complaints about what’s included on the list and what’s not– namely Sol Pais, whom I don’t believe was ever going to attempt harm to anyone before a federal manhunt led to her private suicide– but I’ll worry about my Wikipedia contribution duties later.)
I’ve dragged a d3-fiend friend on board my d3 effort by offering to pay him per-text to be my on-call tech support / Q&A. (It’s not about the money, he’s just kind and wants to help someone learn, and believes he’s more likely to be diligent and prompt if he feels accountable because he’s getting paid.) I find this a charming arrangement. And historically, having to explain the whole stuck point out to someone often results in my solving the problem myself before I even hit send, so it may turn out to be more of a rubber duck situation. We’ll see!
In the next post: Flask basics; enough Heroku to, and ONLY to, get a Flask app live; Jinja.
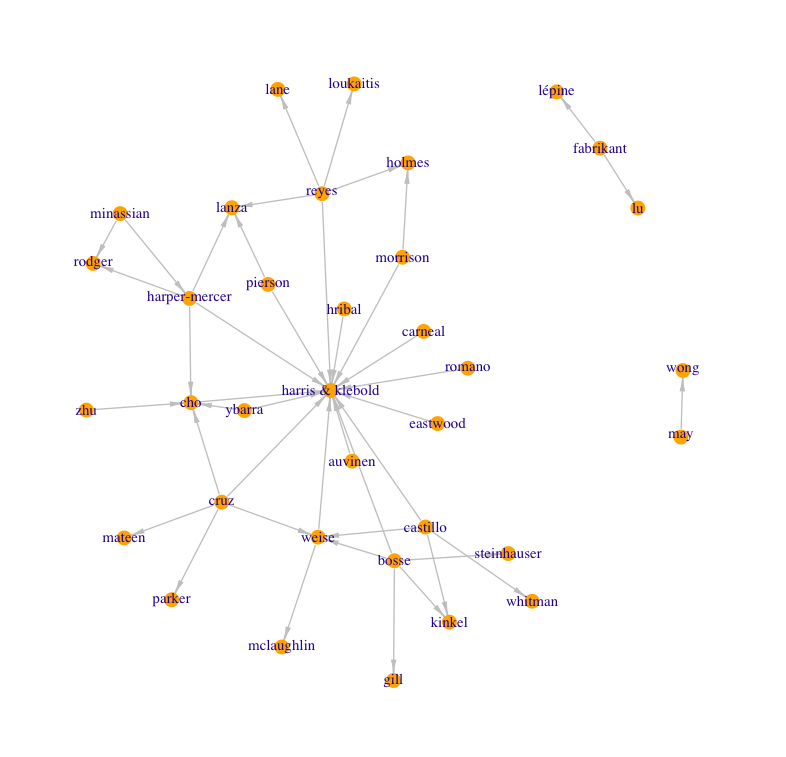
I’m going to skip ahead a bit in this series to show you guys where I’m at so far in my visualization of the graph of rampage killers (upgraded from “rampage shooters” because of my inclination to include Alek Minassian, whose recently released police interview revealed his idolizations of Elliot Rodger and Chris Harper-Mercer– he even claims he was in communication with them, but this is unconfirmed. I have not looked into it, but the podcast Incel claims that the information [e.g. dates] doesn’t line up).
As you can see, this isn’t exactly glorious yet. On top of filling in missing data (I’m conflicted on what to do with Adam Lanza’s references, since he kept a spreadsheet of virtually every mass killer before him period), I want to lay the graph out chronologically– left-to-right by date of event– as most killers do not make reference to anyone who came after them (it does happen sometimes, as still-living killers may make statements in speech or writing during court proceedings, on websites, etc).
In the last post we had gotten through obtaining a list of files (web addresses and descriptions) to download & extract data from. Let’s take a look at one of these.
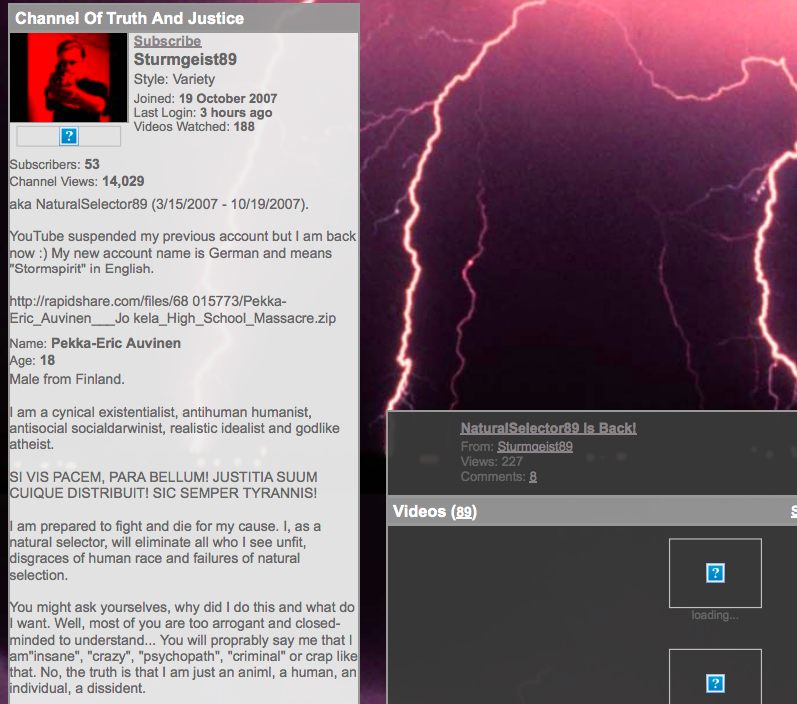
Here we have an image of Pekka-Eric Auvinen’s former YouTube profile. Recall that we are seeking mentions of other shooters and their crimes.
While there is no overt, formal naming of another shooter, someone familiar with school shootings will recognize “Natural Selection” as a catchphrase of Eric Harris, the Columbine school shooter. However the actual phrase “Natural Selection” does not appear– instead, we see that it would be preferable in some cases to use a more general keyword such as “natural + [possible space] + select” (since it could be selectION, selectOR, etc). This generalization will be ideal in several instances. We may also notice the term “godlike” which is another Harris/Columbine meme. Fortunately for us, there are a limited number of shooters with such a substantial “fan following” among other shooters that their speech patterns are reproduced in endless combinations and permutations as in-jokes or references; most of these come from Columbine. In short, we should take note to include non-name references in the name search list as though they were nicknames for the shooters.
We may also notice some socio-political buzzwords that may be of interest later, when we are looking into ideological similarities between shooters other than direct influence. I see “sturm”/”storm” (can be a white nationalist metaphor), “atheist”, “humanist”, etc., as well as loaded descriptions of the shooting action, such as “eliminate” and “my cause” (shooters often reference their “justice day”, “wrath”, “final action”, or whatever). We should start a list of interesting terms to consider later.
We may also note that this is a pdf image and as such we cannot yet ask our computer to search it as text. We will need to obtain searchable text from our PDFs. I didn’t know about this before this project, but apparently there are a few basic types of PDFs:
1) “Digitally created PDFs” / “True PDFS”: PDFs created with software that gives them internal meta-information designating the locations of text, images, and so on: in a sense, the computer can “see” what the naked eye can see due to this internal structure, and there is preexisting, GUI-having, user-friendly software to navigate these documents with ease manually one at a time (or of course you could automate their navigation yourself in such a manner as you desire; I’m just saying that they’re broken down to the point that they’re already cracked open and layed out like a multicourse meal for a layperson to consume– if they have the appropriate tools onhand).
2) PDFs that are just images, such as a raw scan of an original document of any kind, or of a picture, or of handwriting, etc. Just any old thing: a picture of it. There is no internal structure to help your computer navigate this, it’s “dead” in its current state. This is the worst case (aka the fun case for us; you’ll see!).
3) PDFs that have been made searchable through application of (e.g.) OCR to an image PDF, yielding text that is then incorporated into the original document as an underlayer. This text can be selected, copied, etc. This is a good situation. In our case, when we OCR image files, we’ll just go ahead and save the text in a file by itself (one per source image PDF) rather than creating searchable PDFs– because that’s all we need!
This is a case of #2– just a plain ol’ screenshot that someone took of this YouTube profile.
Now, this is a relatively small document in terms of the text contained within it– if I had a transcription of this text, it wouldn’t kill me to just read through it and see for myself if anything notable is contained therein. However, besides the sheer number of documents, a lot of the documents we’re going to be dealing with are these really interminable, deadly-dry court documents or FBI compendium files that are just hundreds and in some cases (cough, Sandy Hook shooting FBI report) thousands of pages long– fine reading for a rainy day or when I’m sick in bed or something, but not something I want to suffer through on my first attempt to get a high-level glance at who’s talking about whom.
(Seriously, some of the content of these things– there’s stuff like the cops doing the interrogations squabbling about when they’re going on their lunch break and “Wilson, stop fiddling with the tape while I’m interviewing!” and people going back and forth about whether they just properly translated the question to the witness or whether they just asked her about a pig’s shoes by mistake, etc.– and Valery Fabrikant representing himself in trial– merciful God! I’m going to have to do a whole separate post on the comic relief I encountered while going through these, both in terms of actually funny content and in terms of stuff that my computer parsed in a comically bogus way, such as when someone’s love of Count *Cho*cula gave me a false positive for a reference to Seung-Hui *Cho*.) Point being, I’m not gonna do this, I’m gonna make my computer do it. So that’s gonna be half the battle, namely, the second half.
First half of the battle is going to be getting the text out of the PDF. Enter optical character recognition (OCR). OCR is, in short, your computer reading. So let’s back it up– when you’re looking at text in some program on your computer, you’re looking at what’s really a manifestation of an underlying numerical representation of that character (meaning your computer knows two different “A”s are both capital As in the sense that they both “mean” [such-and-such number]). It’s not trying to figure it out from the arrangement of pixels of the character in that font every single time. (Honestly I don’t feel I have enough experience in this area to judge an appropriate summary of the appropriate “main” topics, so I’m just going to link out to someone else and you can read more if you like.)
But when the computer is looking at a picture of someone’s handwriting, or a picture of printed-out text from another computer, it’s only seeing the geometric arrangement of the pixels; it doesn’t yet know where the letters stop and start, or which number to associate a written character with once it is isolated. So what would you do if someone in a part of the world that used a totally unfamiliar alphabet slid you their number scrawled on a napkin (which they’d set their drink on, leaving a big wet inky ring)? First you’d try to mentally eliminate everything that’s not even part of the number– any food, dirt, wet spots, etc. Then you’d try to separate out groupings of marks that constitute separate numbers (like how the word “in” has the line part and the dot part that together make up the letter i– that’s one group– and then the little hump part that constitutes the n– that’s the second group). Then you’d zoom in on the grouping that you had decided made up one numerical digit, and you’d look back and forth between that and a list of all the one-digit numbers in that language in some nice formal print from a book that you are satisfied is standard and “official enough”. So you’d start with the first number in the list, and compare it to your number. Now you could go about this comparison a couple of ways.
1) Draw a little pound sign / graph over your number and over the printed number (imagine a # over the number 5). Compare the bottom left box of your number to the bottom left box of the printed number. Plausibly the same or not at all? Then compare the bottom right box. Etc. Apply some standard of how many boxes have to be similar to decide it’s a match, and when you find a match in the list of printed numbers, stop (or, do the comparison algorithm for each entry in the printed list, and whichever printed number has the most similar boxes to your written number is picked as the answer).
There are some problems with this though, namely that things might be tilted, different sizes, written with little flourishes on the ends of the glyphs, etc. in such a way that on a micro level, the similarities are disguised: think of the “a” character as typed in this blog vs. the written “a” character as is taught in US primary school (basically looks like an “o” with the line part of an “i” stuck on the right-hand side). The written, elementary-school-“a” would likely be determined to be an “o” under the # system. Not good. This is called matrix matching.
2) Attempt to identify the major parts, or “features”, of the character. (For example, we will consider the line and the dot in an “i” to be separate features because they’re separated in space, or the lines in an “x” as individual features as they can be drawn in one stroke, or whatever.) For the “a” we have a round part, and on its left a vertical line of some sort. Okay, now we’re talking generally enough that the two “a”s described above sound pretty similar. This is called feature recognition. (As you can imagine, it gets pretty complicated to get a computer to decide how to look for features and what’s a feature.)
So, that’s the game. There are several “engines” / programs / packages / etc for performing this task, and I used Tesseract. It’s pretty great at reading all kinds of *typed* characters, but you have to train any engine to read handwriting (one handwriting at a time, by slowly feeding it samples of that writing so it can learn to recognize it). I had so many different people’s handwritings, and so few handwritten documents PER handwriting, that this didn’t seem like the project to get into that on. I’m definitely going to get back to that for the purposes of transcribing my own handwriting, as I write poetry and prose poetry longhand and have a huge backlog of notebooks to type up (securing all that data is one of my main outstanding life tasks, in fact– there’s really no excuse at this point to endanger all of my writing by leaving it in unbacked-up physical copies).
This post is getting a little long so I’m going to go ahead and put it up and get into the technical stuff in the next post. Peace!
As discussed in my previous post, I’ve been mass-downloading and
automatedly searching rampage shooters’ manifestos, court documents,
etc. for mentions of the other shooters (by name, event, associated
symbols, and so on). For this I used a Python library called Beautiful
Soup, and I’d like to say a few words about how the process goes.
What is Beautiful Soup?
Beautiful Soup (library and documentation available at link) self-describes as “a Python library for pulling data out of HTML and XML files. It works with your favorite parser to provide idiomatic ways of navigating, searching, and modifying the parse tree. ” It is currently in version 4 (hence I’ll refer to it as BS4 from here on), but it is possible to port code written for version 3 without much trouble.
What do we want from it?
To put it as broadly/simply as possible, we want to take a complete website, that we find out there on the internet, and turn it into an organized set of items mined from within that website, throwing back all the stuff that we don’t want. So for example in my project, a major source of these documents was Peter Langman’s database of original documents pertaining to mass shootings. Here it is “normally” and here it is “behind the scenes”. [pic 1, pic 2] Not only am I going to want to download all of these documents and leaf through them, but I’ll need to do so in an organized fashion. So a good place to start might be:
Goal: obtain a list or lists of shooters and their associated documents available in this database.
Using Beautiful Soup
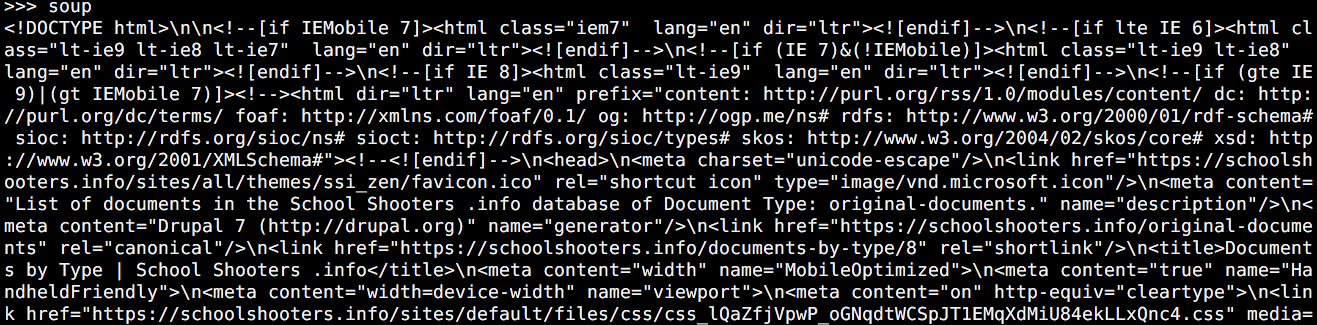
Basically, how it works is that we assign a webpage’s code to be the “soup” that BS4 will work with. We allow BS4 to process the “soup” in such a way that BS4 will be able to navigate through it using the site’s HTML tags as textual search markers, and to pull out (as strings) whichever types of objects we want.
from bs4 import BeautifulSoup site = "https://schoolshooters.info/original-documents" page = urllib2.urlopen(site) soup = BeautifulSoup(page)
Unprettified soup.
I myself chose urllib2. BeautifulSoup (and later prettify) are commands built into the BS4 library. So, we’ve set the scene to allow us to move through the HTML/text, some examples below (these and more can be seen at the BS4 Documentation page).
We can pull out parts of the (prettified) soup by specifying tags, for example:
soup.prettify all_links = soup.find_all("a")
Everything with an “<a>” tag.
Pulling out all the “href” elements within these “<a>” tags…
templist = list()
for link in all_links:
   templist.append(link.get("href"))
One can work with nested tags as well by iterating the same procedure.
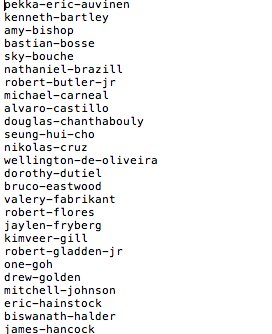
Unfortunately this is still not my desired list of links, but a simple script of the type below can filter for the appropriate strings and create a file listing them.
f = open('linkslist.txt','w+') for item in templist: if "http" in item: f.write(item + "\n")
yields a document such as below. Included are a couple other samples of basic ways one could have fished-out data written to documents. Please note that more documents were added to the database after I began this project, so e.g. the William Atchison files are not included here even though they appear in the “soup” pictures. I’ll synchronize the images later.
So now we’ve managed to extract some data that would have taken much longer to do by hand! Next on the agenda will be mass-downloading my desired files (and avoiding undesired ones) and crawling them for cross-referencing– while avoiding booby traps! See you in the next post.
I’ve been working on my latest project for a long time now, but, having underestimated how complex it would get, was waiting until I had “a draft finished” to post something– ha! Yeah, right! There may never be a true “end” to this project, so waiting for a “complete” draft might mean waiting forever. I’m going to start posting periodic updates as I pass through stages of the project instead. So, without further ago, introducing:
Citation Networks in Rampage Shootings.
Background: In my experience, media coverage and anecdotal discussion of mass shooting events typical portray them as essentially unconnected natural disasters. But as it turns out, “climatology” is a very complex science…
In the last few years the US public has started to realize that there is an element of media influence involved in the motivation for perpetration, and academics have begun to analyze the characteristics of perpetrators (examples: race, age, mental health diagnoses on record, year shooting committed) and even the frequency of some contents in their writings; for example this Peter Langman paper (link does not directly open the large document). We are able to do this because of the great deal of shooter/event information available to the public via the Freedom of Information Act (FOIA)
Alex Hribal’s journal, 2014
Aaron Ybarra’s journal, 2014
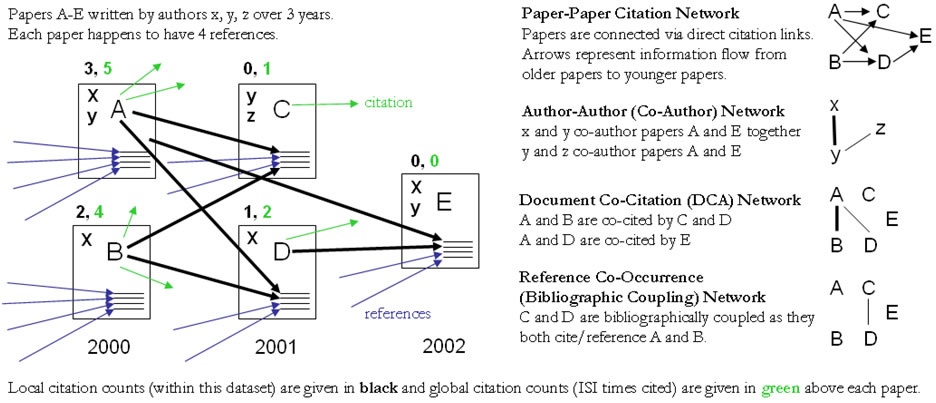
However there is not a concentration on rampage shootings as a covert political movement of sorts, and/or a type of abstract terrorist network operating in single-cell units. I posit that this is a useful conception, as expressed by a network (acyclic directed graph) of “citations” between rampage shooters. The existing methodology of citation analysis can provide a framework or guide for this expression. For now, I am concentrating on creating the most thorough network I reasonably can while maintaining relevance to my interests and an appropriately tight scope (I’ll elaborate).
My vague “starting goal”: Obtain and organize documents (primarily manifestos) associated with rampage shooters, and datamine them for cross-references. Create a visual network.
My concretized, “actionable” goal: Scrape the web for documents written directly, or otherwise generated directly (e.g. FBI report list of websites visited by shooter as found on his computer), by a restricted population of mass shooters (starting with those on Langman’s schoolshooters.info website). [✔️] Process them all into searchable text (as some are PDF, handwritten, etc). [✔️] Create a list of shooter-associated names and terms (names, nicknames, schools attacked, and unambiguous referents) [✔️], and directly search the documents for these names/terms, creating a list of citations apparent between shooters (which will need to be cleaned for redundancy and ongoingly manually checked to see if the results are making sense). Go through and throw out false positives, attempt to identify false negatives from personal knowledge of the documents (which I viewed individually when classifying during OCR pre-processing). Create a visualized network of citations [❌] where the graph is an acyclic directed graph, the nodes are shooters, and the edges are citations. Ideally, the nodes will be physically laid out along a timeline. [❌]
Where I’m at now: ✔️ Outline my goals. 🆕 Blog about same. ✔️ Define the population to be included (restricted set of shooters). Start with shooters represented in Langman’s original documents database, and work outward from there. ✔️ Scrape the web for documents using BeautifulSoup. 🔜 Blog about the web scraping.
✔️ Learn what OCR options are out there. Use OCR and manual/voice transcription to convert all document types to searchable .txt files as follows. First classify all documents according to their status: useless document, desirable and already usable txt, desirable but needs OCR, desirable but handwritten / otherwise illegible to conventional prefab OCR. Use tesseract and other packages until either every typed document is successfully hit or I conclude that that is not going to happen anytime soon. For everything else, decide whether it’s worth training AI to decode the writing/printing style or whether it’s better to just grind it out by transcribing manually or reading aloud into a voice-to-text processor. 🔜 Blog about the document processing.
✔️ Create list of terms and names associated with each shooter. ✔️ For each shooter, use Python to mine associated list of outgoing citations (of other shooters in this set) from documents. ✔️ Review identified citations, scrutinize sensitivity and specificity. ❌ Repeat until satisfied. 🔜 Blog about the comedic mishaps encountered along the way (no spoilers, but let’s just say I had some very confusing results for awhile).
❌ Decide which language(s) to create visuals in. ❌ Create formal nodelist (easy modification of shooter list) and edgelist (slightly harder but still pretty easy translation of citations list/log once created). ❌ Plot and prettify visual graph. ❌ Partially order nodes in time, place physically along a timeline.
💭 Node expansion goals: flesh out the network with all “iconic figures” mentioned, starting with other mass shooters (not from Langman), then enlarging to other mass killers, then killers in general (e.g. Hitler) as well as media (e.g. The Basketball Diaries). Needless to say many of these would not need to be searched for most outward citations (e.g. The Basketball Diaries is likely not citing any modern shooters). 💭 Edge expansion goals: grow the network into a set of hypergraphs with edge criteria such as: same type of weapon used (may need consultation as to what is similar enough to constitute probable mimesis), similar poses in images released, same type of manifesto (video, etc) released to the news intentionally, and so on. Each criterion could be represented by a different color, for example, if we wish to be able to toggle through criteria– perhaps create a mini interactive network where the user selects the criterion. 💭 Incorporate visual citations: Consider pictures released to the public by shooters that contain visual references to other shooters. Most of these are to Columbine. We have the “wrath” & “natural selection”-style “uniforms”, the Dylan Klebold gun-finger wave, and so on.
Coming soon… Perils and adventures encountered putting my first toe in the web scraping waters!